CarlAnomaly A large-scale multimodal anomaly detection benchmark for autonomous driving
728 human-verified driving scenarios from the CARLA simulator, with synchronized cameras, LiDAR and vehicle telemetry, and ground-truth anomaly labels from single pixels up to whole scenarios.
No pixel mask: this anomaly is labelled per timestep and per scenario only.
- Scenarios
- 728
- Annotated timesteps
- 491,100
- Anomaly types
- 9
- Evaluation tiers
- 4
- CARLA towns
- 6
- Total size
- 1.3 TB
Overview
Autonomous vehicles operate in an open world where rare, unexpected events are unavoidable: unknown obstacles, erratic drivers, sudden weather changes, failing infrastructure. Detecting these situations is a safety requirement, yet existing benchmarks either lack anomaly annotations or are limited to single images without temporal or multimodal context.
CarlAnomaly fills this gap. Detectors are trained on normal driving only and must flag anomalies at test time, from the pixel or LiDAR point where an anomaly appears to the timestep and the scenario that contains it.
- Sensors
- 4 RGB cameras with depth and instance segmentation, semantic LiDAR, GNSS, IMU
- Metadata
- Weather, collisions, autopilot control signals
- Training split
- 101 normal scenarios of 5 min, 6 towns
- Test split
- 627 scenarios of 30 s, 107 normal and 520 anomalous
- Verification
- Every scenario reviewed independently by two annotators
- License
- MIT
Anomaly types and evaluation tiers
Nine anomaly types cover unknown objects, objects in the wrong context, events that only make sense over time, and shifts in sensor input. Scores aggregate from fine to coarse: pixel or point, sensor, timestep, scenario. Types without a spatial extent enter that hierarchy at the timestep level.
| Anomaly type | Category | Test scenarios | Sample | Sensor | Timestep | Scenario |
|---|---|---|---|---|---|---|
| Debris spawn | Contextual | 120 | ||||
| Turned-off traffic lights | Unknown object | 8 | ||||
| Traffic light flickering | Temporal | 30 | ||||
| Traffic light yellow blinking | Temporal | 78 | ||||
| Erratic driver | Temporal | 10 | ||||
| Running pedestrian | Temporal | 9 | ||||
| Vanishing actor | Temporal | 70 | ||||
| Instant weather change | Temporal | 97 | ||||
| Streetlight flickering | Covariate / temporal | 98 |
Baseline results
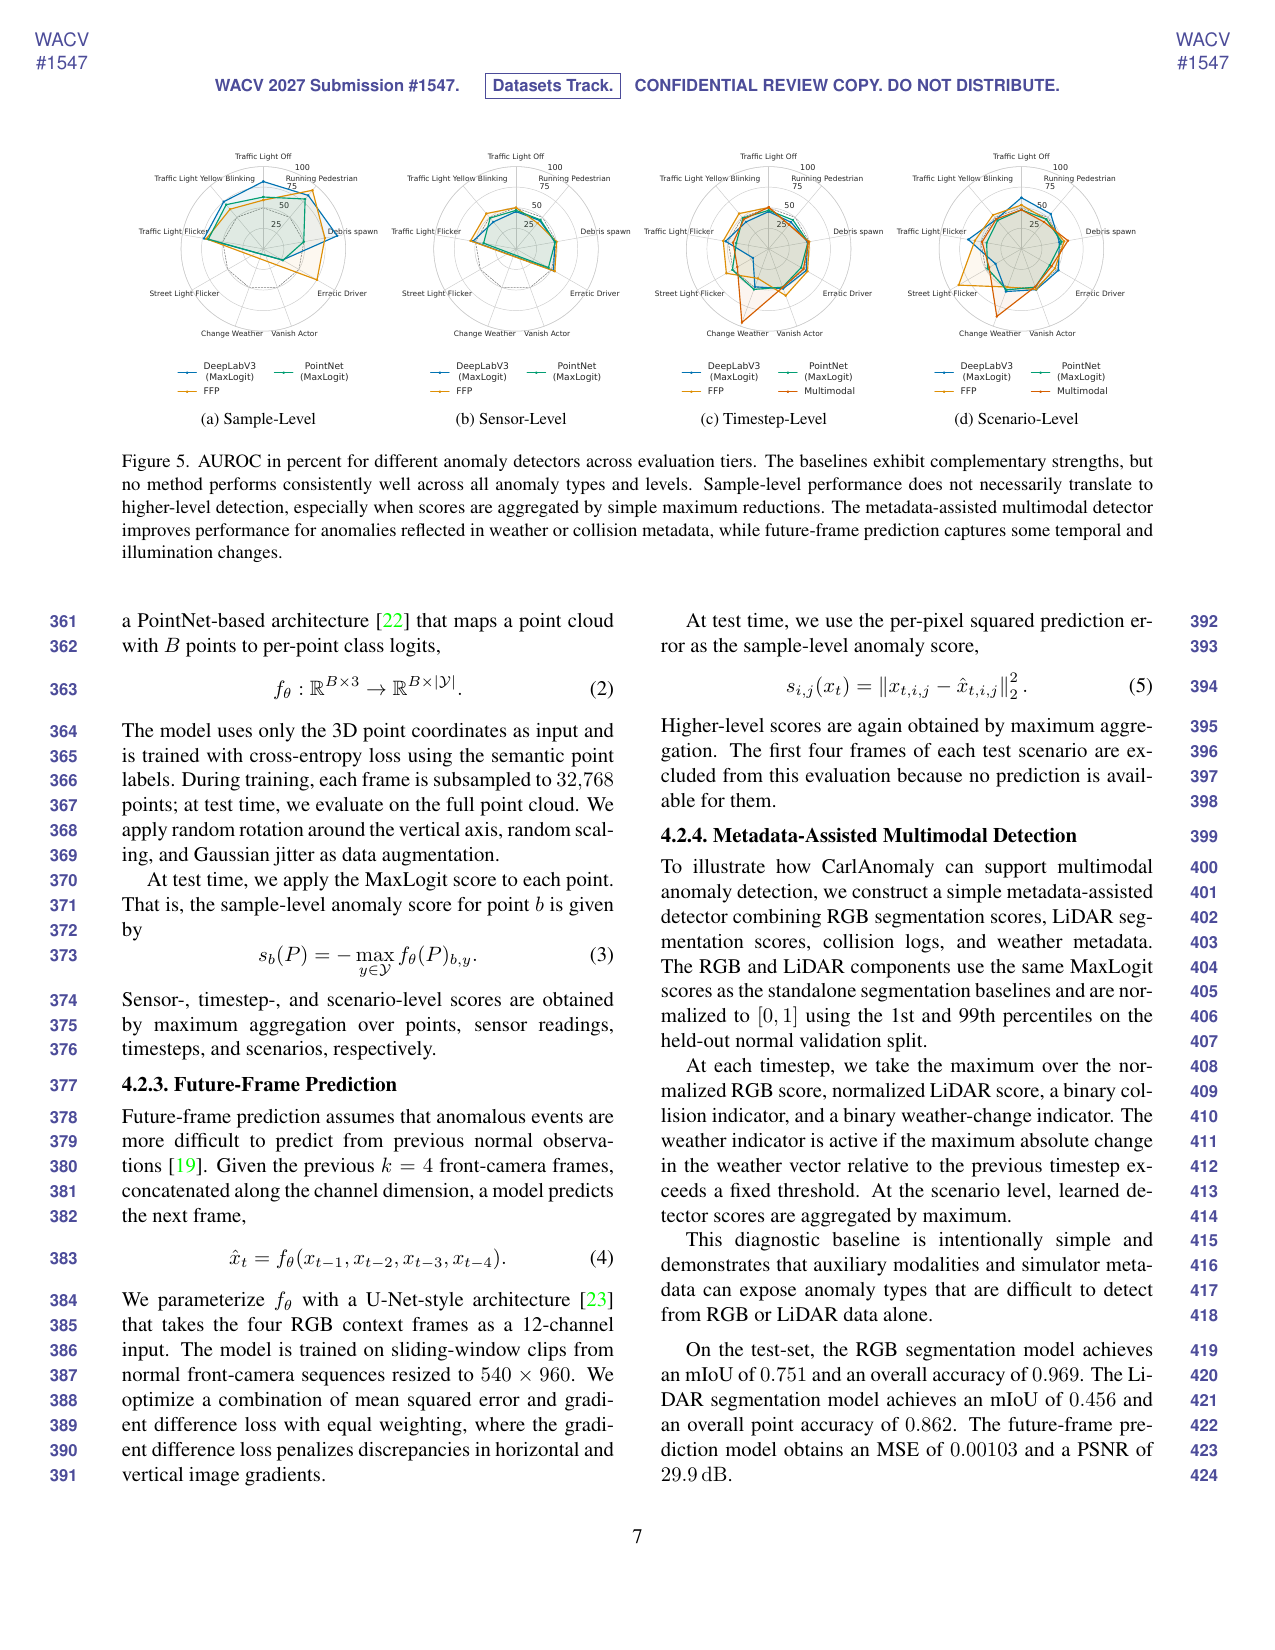
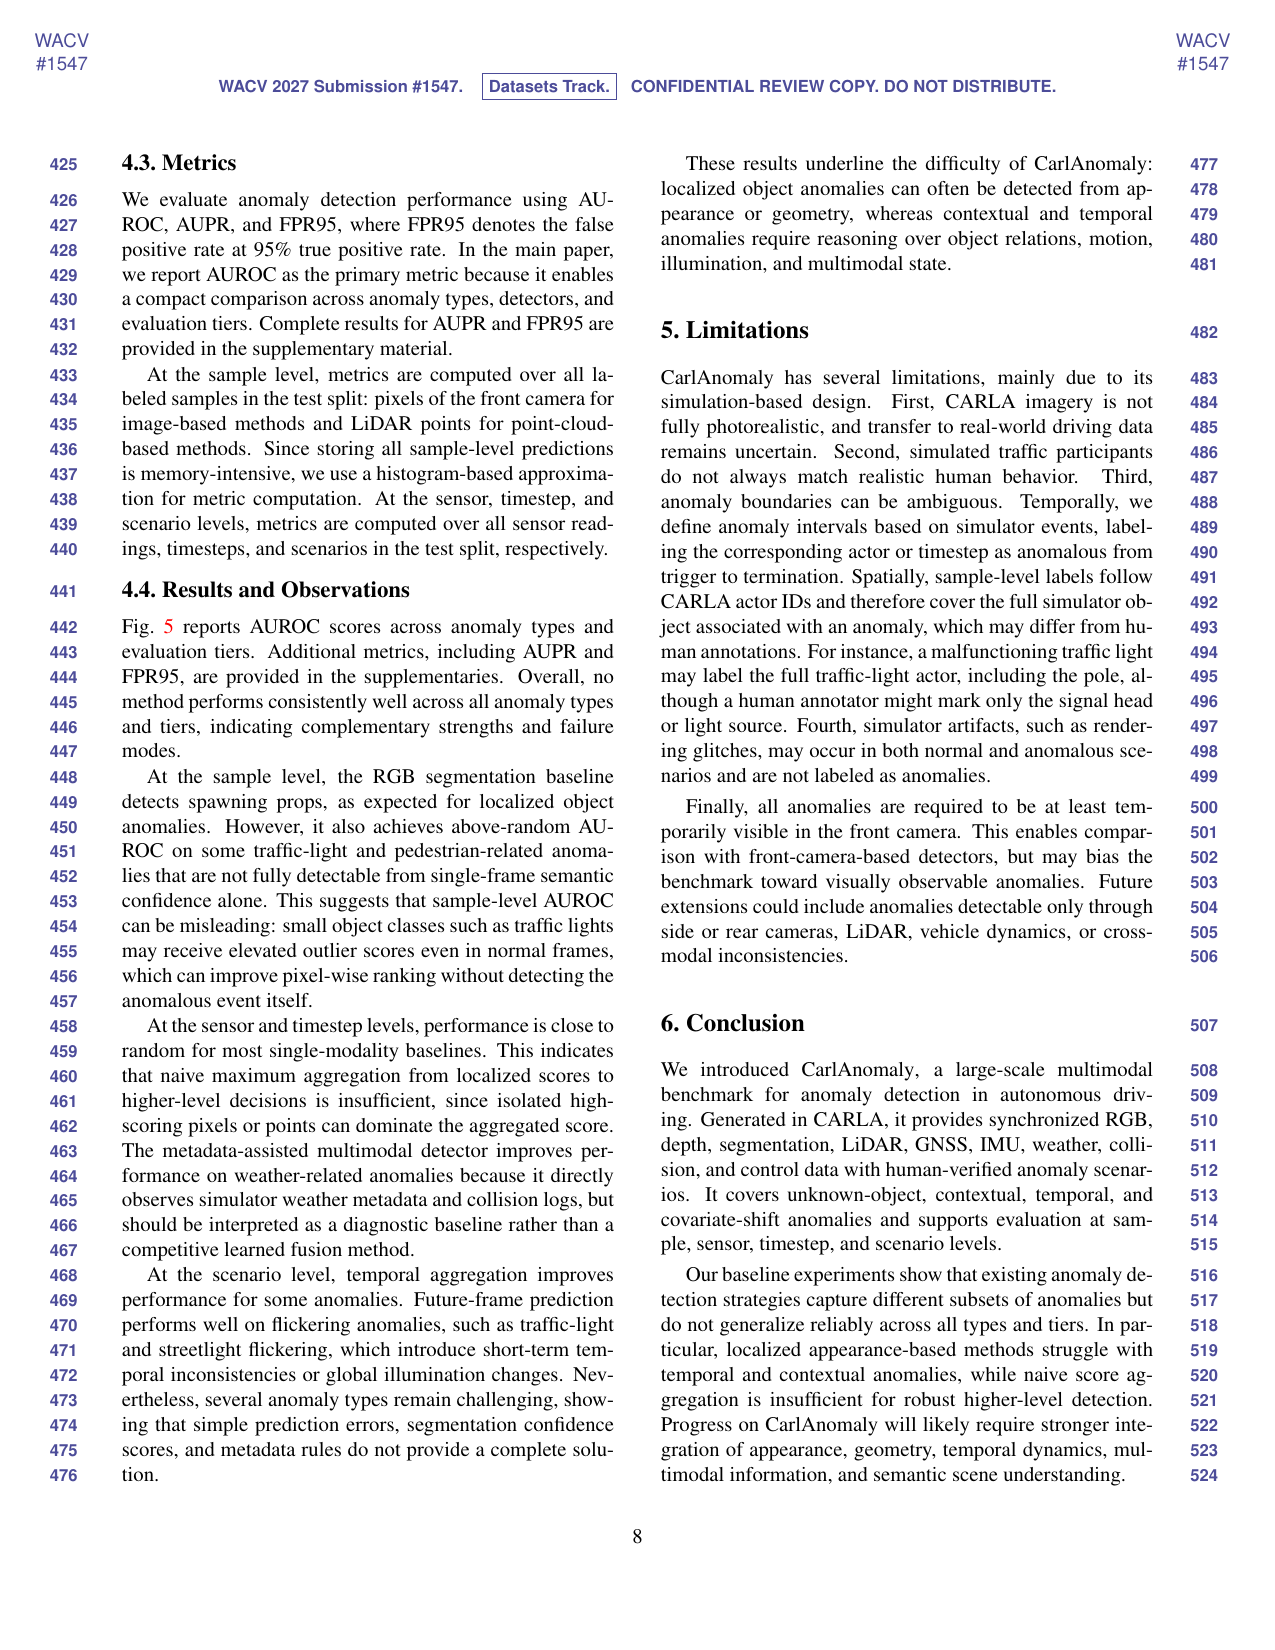
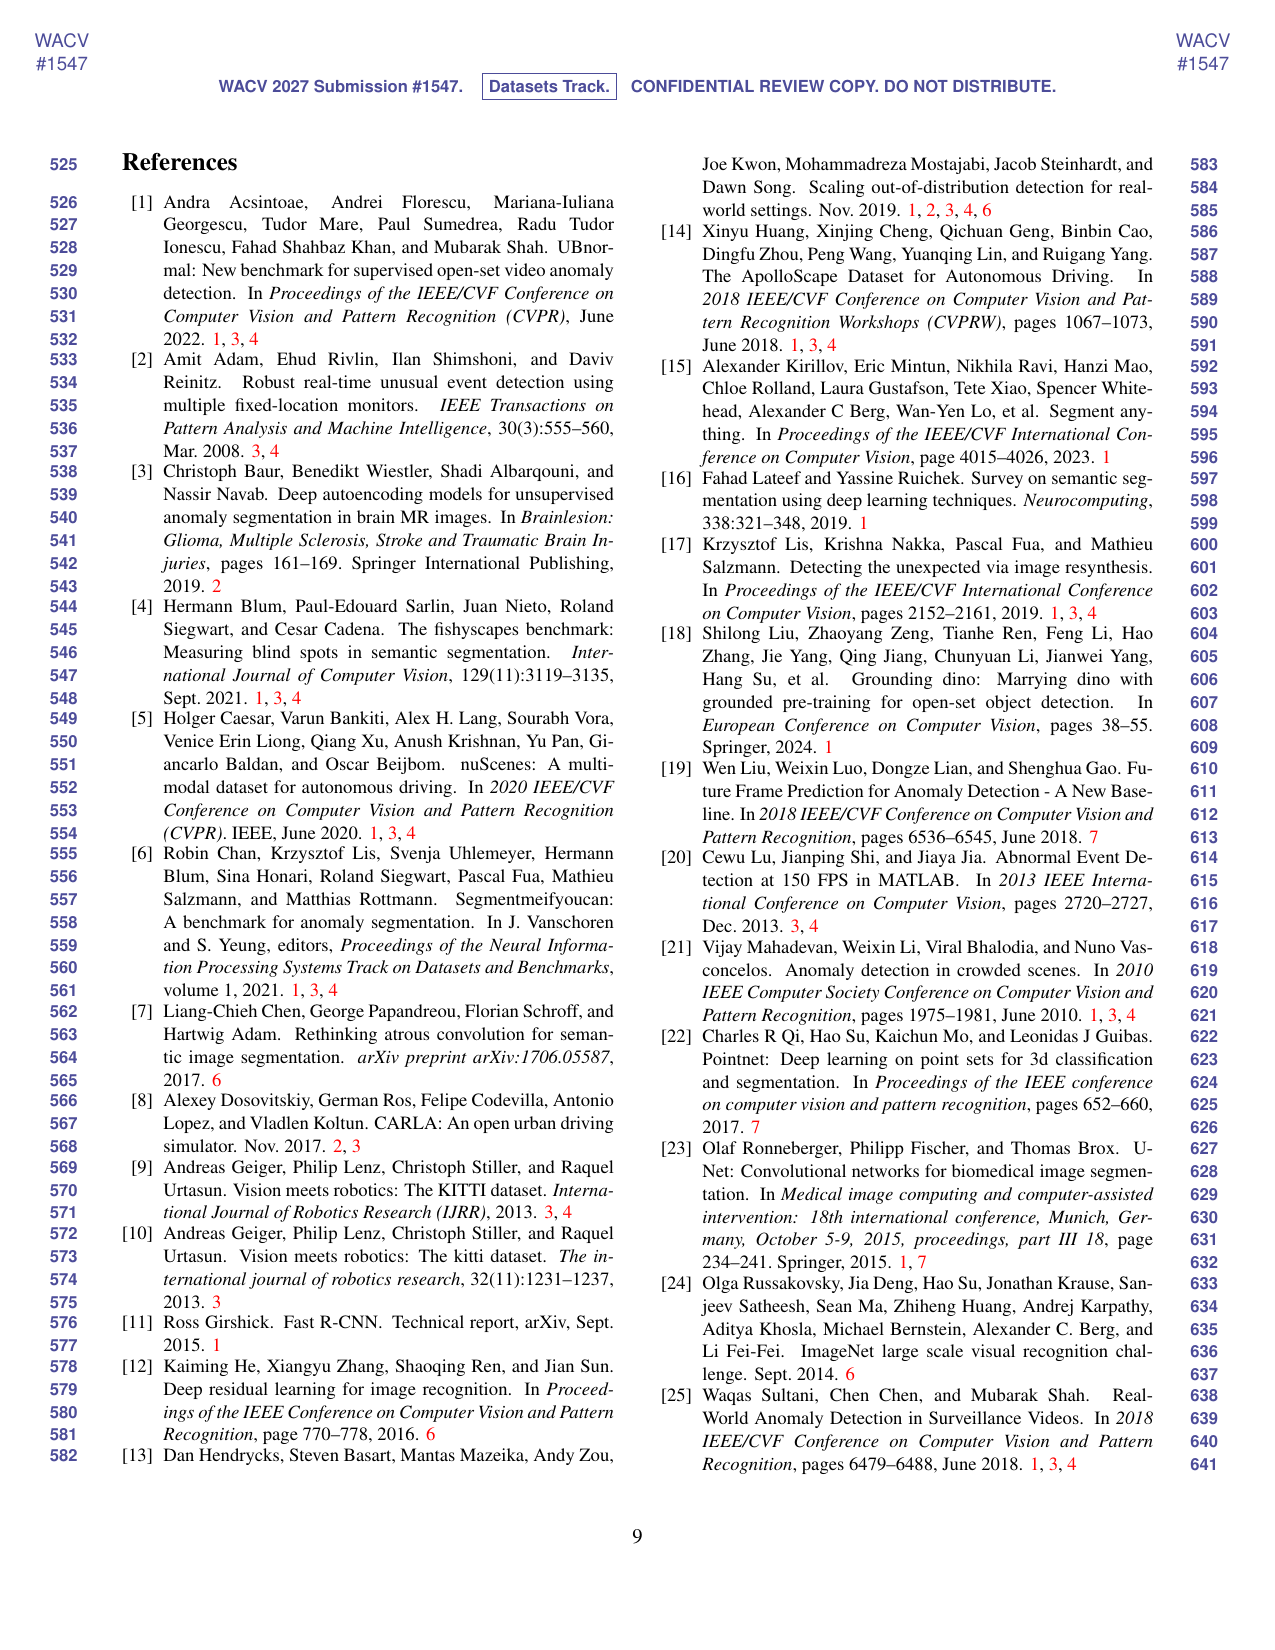
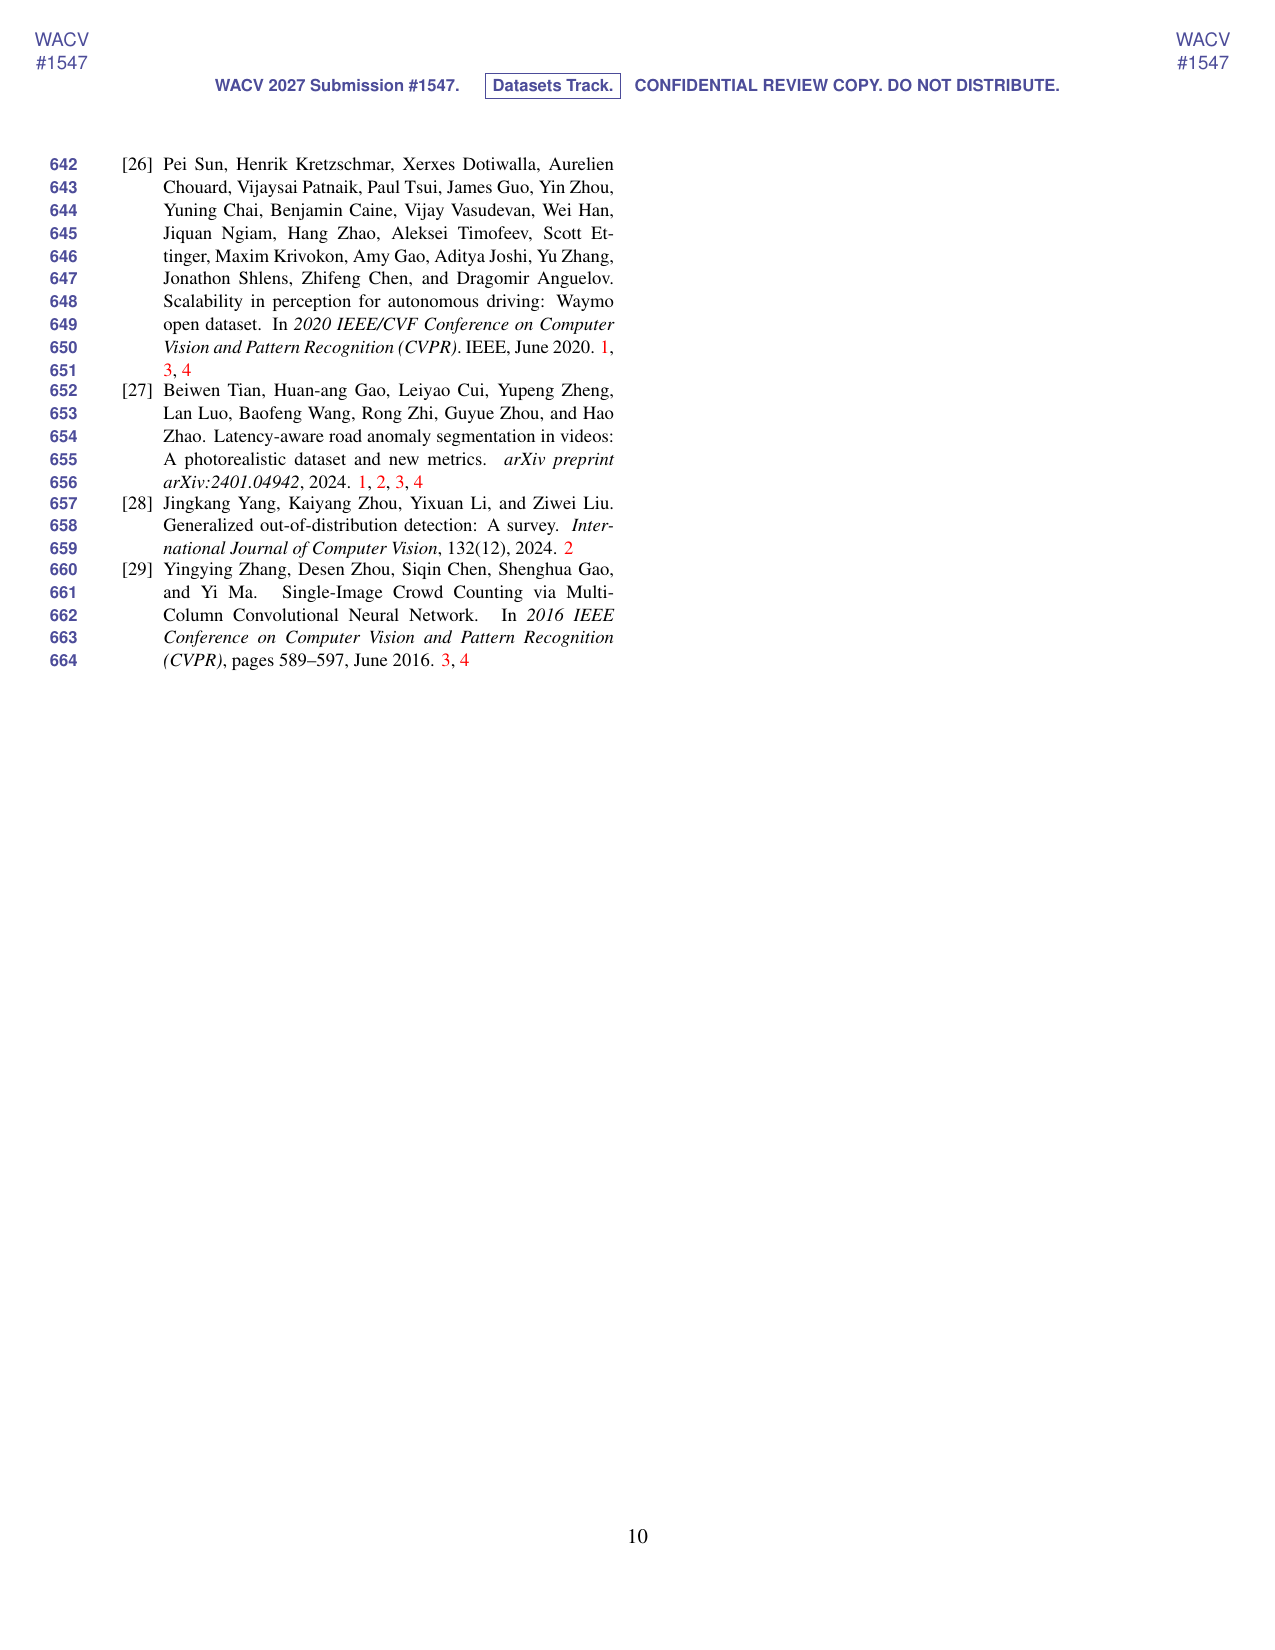
Average AUROC over anomaly types. The best detectors reach 73 at the sample level, but none exceeds 57 once evidence has to be aggregated over sensors, timesteps and whole scenarios.
| Method | Sample | Sensor | Timestep | Scenario |
|---|---|---|---|---|
| RGB Segmentation | 72 | 48 | 45 | 53 |
| RGB Mask2Former (RbA) | 30 | 57 | 55 | 53 |
| LiDAR Panoptic Segmentation | 50 | 45 | 46 | 44 |
| Frame Prediction | 73 | 51 | 51 | 56 |
| V-JEPA Prediction | – | 52 | 51 | 54 |
| Multimodal (Fused) | – | – | 50 | 51 |
Bars show the distance from chance (50): above, below, full width = 25 points.
Cite
The BibTeX entry will appear here once the paper is published.